saahei.ai
Saahei: Digital Secret Shopper

Overview
As Co-Creator and Designer for Saahei, an innovative AI-powered platform for analyzing omni-channel customer journeys, I led the design of a fully functional prototype, translating the initial vision into a tangible user experience. My responsibilities encompassed creating the Saahei brand identity and designing the complete UX/UI for both mobile and desktop applications.
For my portfolio I wanted to showcase key stages of that design process, from early whiteboard ideation and wireframes to interactive video demonstrations of the platform's core features. A central challenge was the design of 'digital twin' personas ('sentinels'), requiring the creation of unique, customizable profile cards with distinct visual identities. I also tackled the complexity of presenting extensive sentinel activity logs through an intuitive decision-tree timeline, informed by in-depth research into real-world user behaviors.
Though Saahei ultimately stalled due to the high costs of launching a B2B SaaS AI solution in 2018, this project provided invaluable experience in designing for AI.
Role
Brand Identity Creation, UX/UI Design, Investor Pitch Deck Development, Prototype Design, System Design for Digital Twins, User Research Leadership
Inspired by the human eye, it symbolizes our focus on clarity and foresight. The design elements echo the concept of digital twins, acting as digital sentinels to monitor, analyze, and deliver insights.
Strategic Foundations
Before the code, before the design, there was the idea. This section offers a glimpse into the very first stages of Saahei's creation – the whiteboard sessions, the rough sketches, the exploration of use cases, the charting of user journeys, and the initial planning of the platform's sitemap. This is where it all began.

From whiteboard to wireframe: The initial brainstorming and first wireframe sketch for Saahei, capturing early ideas and outlining the platform's core structure.
Platform Design and Navigating Complexity
A core focus was creating unique "sentinel/persona" cards, baseline customer profiles with distinct visual identities and customizable attributes. Significant design challenges were addressed, particularly in the development of the activity timeline, where a decision tree layout was implemented to manage and display extensive sentinel activity logs in a clear and user-friendly manner.
Extensive research informed the creation of realistic timeline events, ensuring the platform's data felt authentic. The videos also demonstrate the comprehensive Summary dashboard, which presents key performance indicators (cadence, compression, consistency, collision states), charts, observations, and search terms, all while maintaining a clean, focused, and visually balanced design despite the density of information.
Throughout, the emphasis is on creating a new and refreshing user experience, balancing a rich feature set with intuitive navigation and clarity.
What characteristics define your ideal customer? Saahei's monitoring begins with creating a 'digital persona' that embodies those traits, acting as a realistic digital customer. To achieve this, I designed unique 'sentinel' persona cards, going beyond basic demographics. Each card features a customizable visual identity, a distinctive color palette, a defined personality, and a specific geo-location (shown in the left sidebar), allowing for precise targeting and realistic simulations. I also built in further customization options for specific research scenarios.
Overcoming the Design Challenge of Saahei's Timeline. This video shows the evolution of Saahei's timeline feature. My initial sketches explored various approaches, but presenting a large volume of sentinel activity logs in an easily digestible way posed a significant design challenge. The solution: a decision tree layout, organizing information into clean, unique cards with custom icons, allowing users to easily scroll and track all activities.
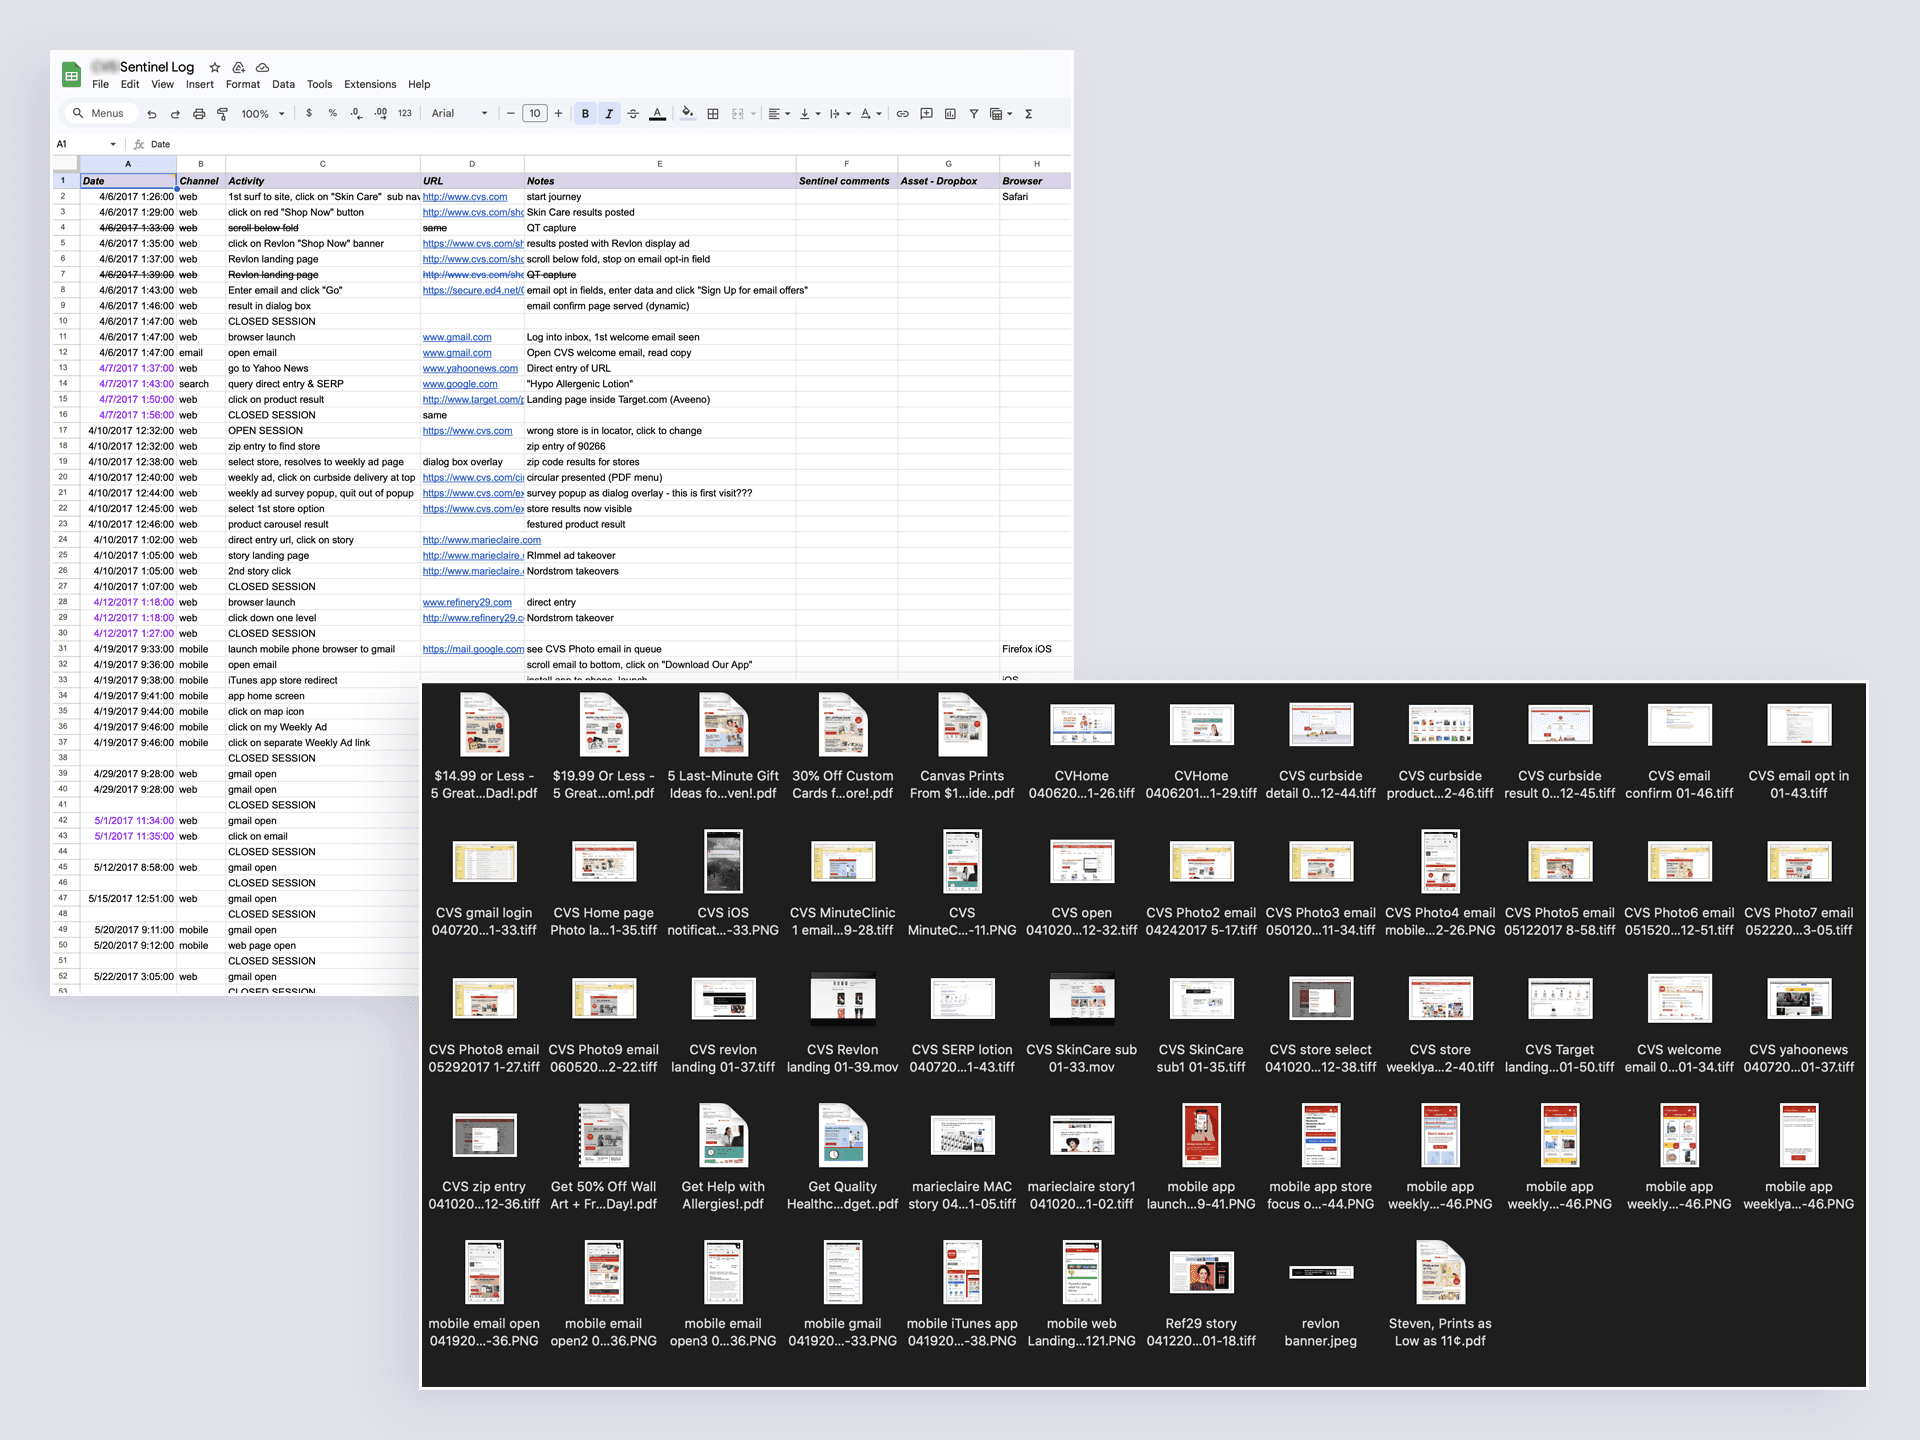
To ensure the sentinel activity logs felt genuine, I conducted in-depth research into real-world timelines and event patterns. These spreadsheets document a portion of that research, used to define the data structure, event types, and overall design requirements for the timeline feature.
This video highlights the key features of Saahei's timeline: the decision tree structure, detailed activity logs, integrated photo documentation, and the ability for sentinels to leave insightful comments on specific events. Follow a digital mystery shopper through the entire process.
The summary dashboard displays key metrics (cadence, compression, consistency, collision states), insightful charts, observation summaries, and top search terms. A significant design challenge was creating a clean, focused, and visually balanced layout, despite the wealth of data presented.